Storytelling can be an engaging component of history education and historical thinking. Telling a compelling story and using film or digital projects allows learners to interact with history differently reading based learning. Making history entertaining does not diminish it but can offer an opportunity to approach a subject differently. In a learning environment, film and digital storytelling can be the launching point for working on historical thinking and analysis.
When I taught leadership to ensigns a lifetime ago, we usually ended the course with a movie about leadership and crisis, from The Caine Mutiny to 12 O’clock High. These work well to lead into a capstone type discussion for while they entertained – Bogart and strawberries is funny on the surface – they opened further discussion points on crisis leadership, relationships, and followership. A tool for learning history and historical thinking, films can do the same thing. I reviewed Hacksaw Ridge for an assignment, and it would be an intriguing one for a class. Were I teaching it, I would tee up assignments relating to conscientious observers, reading first-hand accounts of the Pacific campaign, discussion of attitudes toward the Japanese, and the toll of the war on the home front. Another potential topic is what is left out. The movies tight focus on Private Doss and his company did not afford a look at another part of the tragedy at Okinawa, the mass suicide of civilians afraid of what the American troops may do to them.
Part of the assignment would be learning about Bedford, Virginia, home to a memorial to the “Bedford Boys” who died on D-Day and the National D-Day Memorial. Bedford is a typical small town, but in June of 1944 suffered the highest per capita loss on the beaches of Normandy.
Film and digital history projects can bring a different perspective and, hopefully, develop empathy. It is a very human reaction to identify with the characters in a story, so that can be channeled into a wider view of the world being portrayed as well as the challenges faced by the people living in it. Creating digital history projects also allow students to engage with material differently, thinking about not only the sourced information, but thinking about the audio and visual representation of the subject.
Dismissing film and digital projects as space fillers in a learning environment misses out on an opportunity to take history off the pages and encourage interest in further learning.
In May 1940, the German Army crossed the border into the Netherlands; five days later the small nation capitulated and the Bezetting, or occupation, began. The Arnhem Postal History Project offers a view of everyday life in this period, through postal covers, postcards, correspondence and documents. The collection consists of several thousand items, this study uses the 86 pieces in the Forced Labor group and four from the Operation Market Garden and the Aftermath group. The data set is made up of postmark information (date and location), addressee names and addresses, sender names and addresses, and where the item went through German censors if marked, and the associated latitudes and longitudes. The project uses kepler.gl to map the items as an experiment in mapping and understanding the data set.
Forced Labor
All of the countries occupied by the Germans had seen impressment for labor in factories and on farms, and as the war continued, replacing those conscripted for military service. Laborers were taken from Russia, Poland, France, Belgium, Denmark, Norway and the Netherlands; the numbers included the Jewish citizens of those nations as well, forced to labor in the concentration camp system.
In the immediate aftermath of the invasion and early days of the occupation, Dutch prisoners of war were used to clear rubble and do repair work while awaiting disposition.1 Attempts to recruit volunteers met with limited success, leading to impressment of civilians for labor details, both small and large. Among the ways of increasing manpower was the Opbouwdienst, a program to keep discharged soldiers employed through working on roads and drainage. The program became the Nederlandse Arbeidsdienst (NAD) that offered exemption from being sent to Germany for six months’ service. By the spring of 1942, NAD service was compulsory, with harsh punishment for those who tried to evade it, or avoid being called for service in Germany. 2
Conscripted workers worked in factories, on farms, on the construction of defenses (for example the “West Wall” defensive positions in the Netherlands and Denmark), and public works projects. While some did choose to volunteer for work with the promise of better pay and food, much of the labor did not. The workers suffered poor working conditions and risked injury or death from the Allied bombing campaigns.
The tremendous losses suffered during the Russian campaigns as the war progressed, particularly the loss of 500,000 men at the Battle of Stalingrad, put a strain of German resources. The necessity of raising more troops and replacing lost equipment from that campaign increased the demands from commerce and industry to make up the shortfall in labor. This labor shortage led the German authorities in occupied countries to ramp up efforts to recruit or conscript workers.
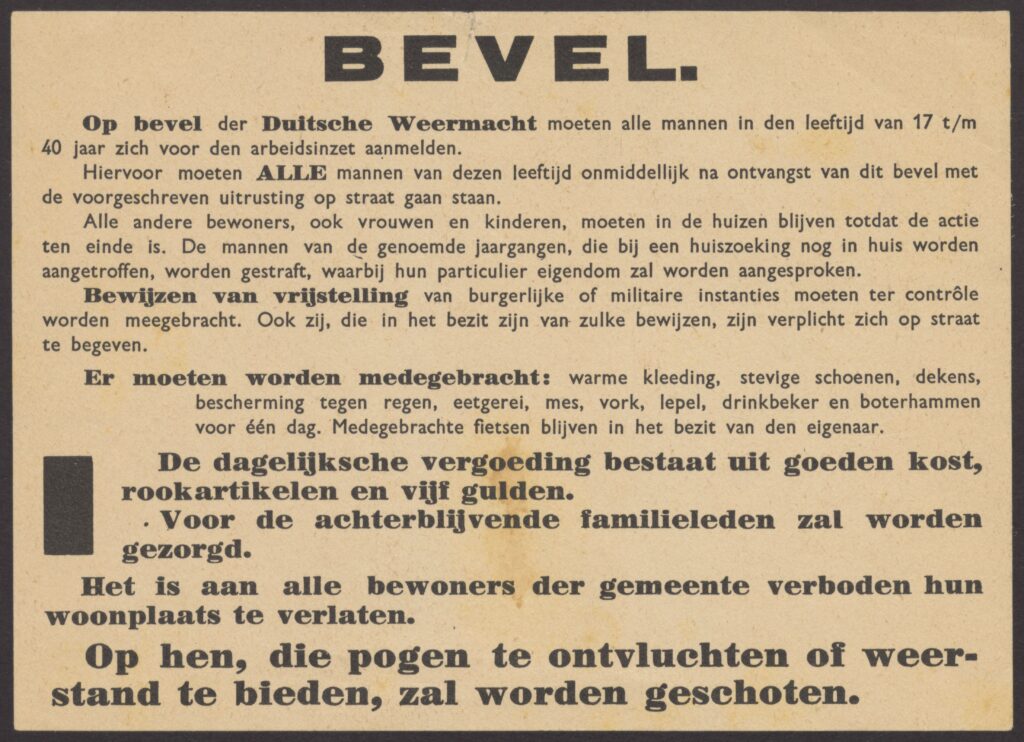
When larger number were needed, German authorities conducted razzia (raid), rounding up men in the streets and at home. Men and women rounded up in the razzias were impressed into labor predominantly in Germany. Men were required to register and report for voluntary work, and when that failed, razzias were used to fill the quotas.
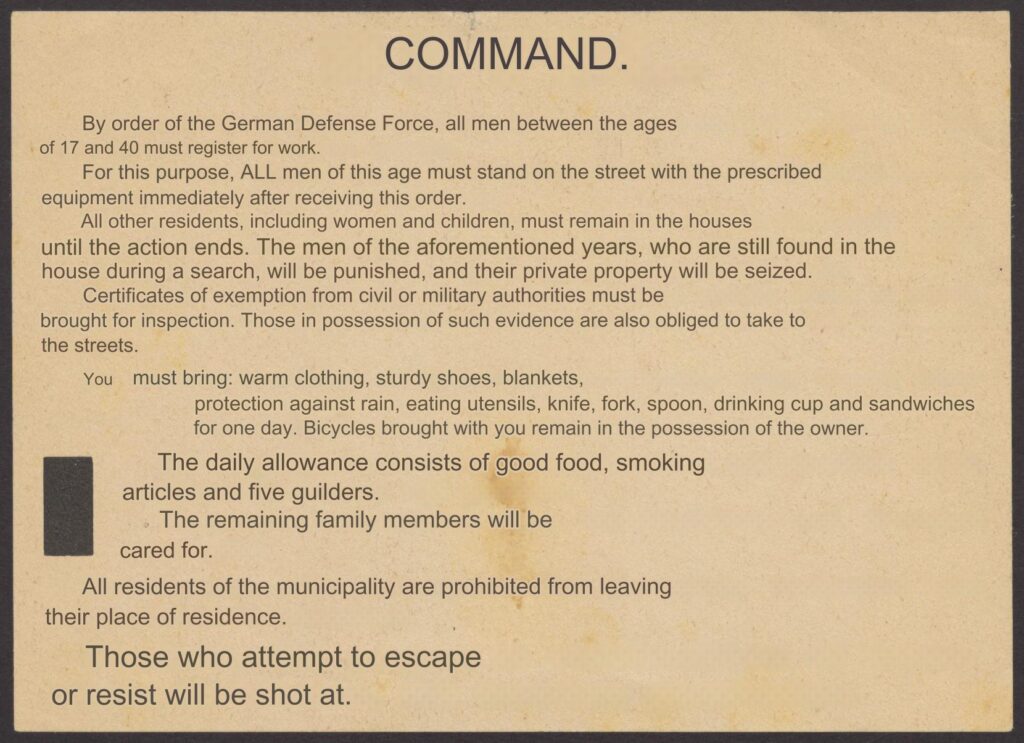
Order delivered in Rotterdam, 9 November, 1944 with translation from Google translate. Arnhem Postal History Collection.
One of most notorious razzias occurred in Rotterdam November 10-11, 1944, which rounded up 52,000 men for service in agriculture and industry in the eastern provinces of the Netherlands and Germany. During “Aktion Rosenstock” all roads and bridges out of Rotterdam and Schiedam were cordoned off, preventing escape from the cities. 3
Correspondence to and from Labor Camps
Using a sample size of 90 items from the Operation Market Garden and Aftermath and Forced Labor (volumes I and II) from the Arnhem Postal History Project, we can get a snapshot of what forced labor looked like to the families and friends of those sent to other location in the Netherlands or Germany for work.
Map 1: Routes taken by correspondence and volume over time
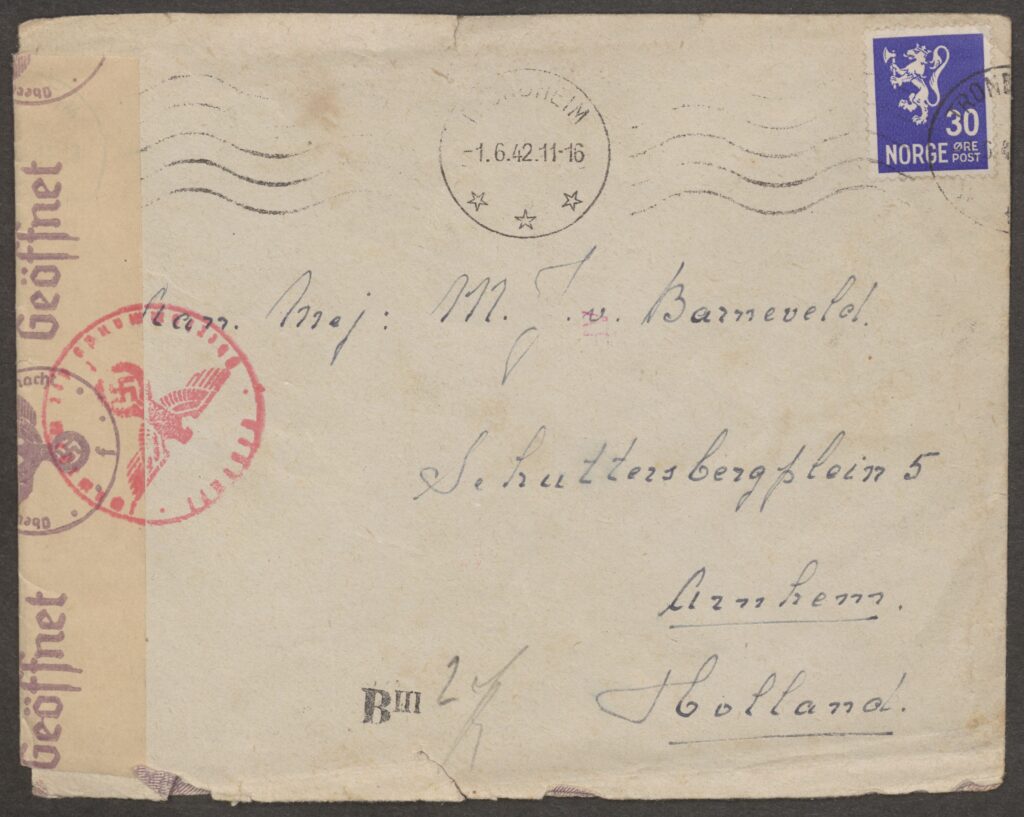
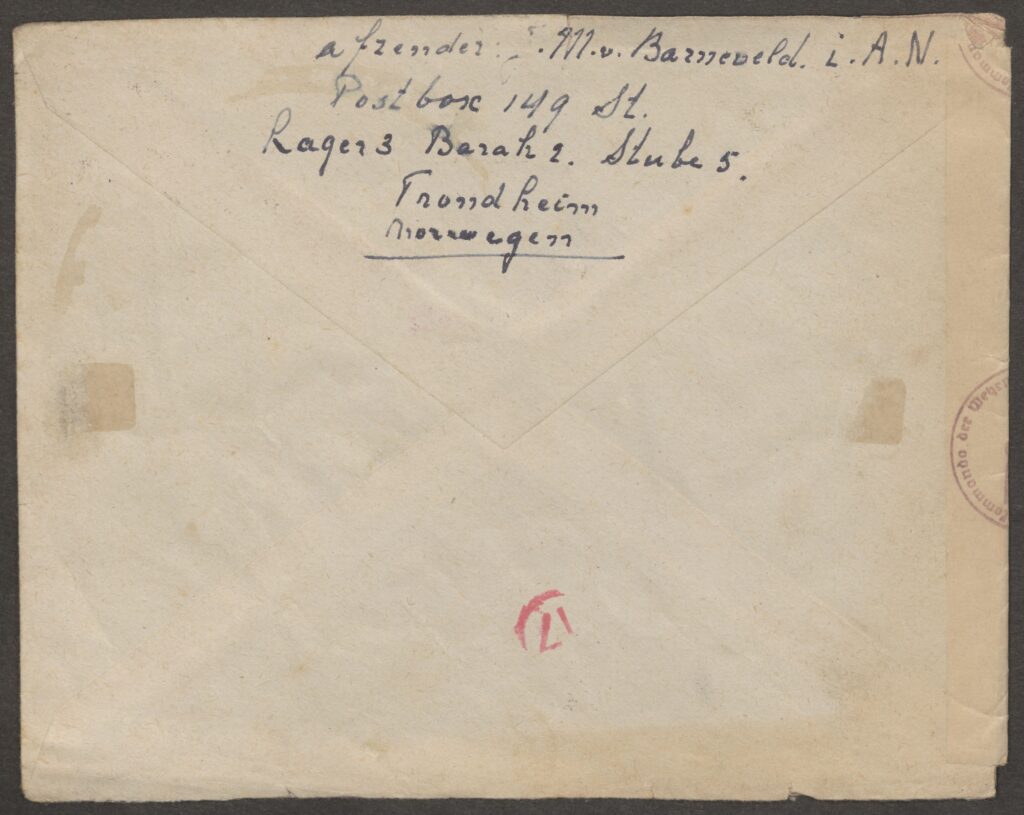
Map 1 is an overview the ninety pieces, this shows the breadth of the forced labor programs, with correspondents not only in the Netherlands, but as far away as Trondheim, Norway. The Trondheim piece is the earliest of the group, unfortunately the letter that accompanied the postal cover was lost.
Envelope from Trondheim to Arnhem. The postmark date is June, 1942. This letter was censored in Hamburg, indicated by the “f” in the stamp.
Map 2: Cluster graph of sender locations
Map 3: Cluster graph of addressee locations
Maps 2 and 3 break out the locations of both the senders and the addressees.
A close examination of the Map 1 will show a some outliers of interest; there are a few arcs connecting labor camps to each other. The correspondence was between J.J. Buurma, forced to work in the Mauser armament factory near Berlin, and J.J. (Hans) Sprey, in the Mauser factory in Oberndorf am Neckar. The second pair was Arie Pot, at a camp near Munich, writing to L. (Bertus) Ruijt in a factory near Köthen.
Map 3: Burma and Pot letters
Censorship
All media and mail in the Netherlands was subject to German regulation and censorship. Most of these items were censored in Cologne, Germany, with the exception on one piece, again the Trondheim cover, censored in Hamburg.
Map 4 below is a visualization of the effect of censorship. The red lines trace the correspondence from the sender to the censor’s location, in these examples either Hamburg or Cologne. The green lines represent the movement from the censor to the destination.
Map 4: Effect of censorship on correspondence pathways
Although several items have additional postmarks that indicate passage through the censors was frequently fairly fast, the omnipresence of the state ensured control of information throughout.
Challenges: Mapping the Data Set in Kepler.gl
Mapping the data set included several challenges related to georeferencing and quantity of data for visualizations.
Georeferencing turned out to be more difficult than anticipated, in part due to many of the addresses being simply a camp name. The visualization still works, mapping to the city or town named on the item, but for granularity it would be a problem. Georeferencing in both Excel and Google docs required add ins, I used a free script from GitHub and created the extension in my Google doc.
The sample size of the data set created two challenges. Setting up the kepler.gl filter for the timeline had a steep learning curve, as my first several tries failed. Working through the problem, I had to shift to month/year instead of month/day/year. The second challenge of the data set was that the bulk of the collection was related to four separate groups of people, accounting for 59 of the 90 items and lines. The effect of this was fewer distinct lines of travel for the items.
Person 1
Person 2
Forced Labor Assignment
No. Items
Louis Bernaards
Marie Pilings/Andrea Bernaards
Worker in Mauser factories
14
T.J. Verseveldt
Gezina Cornelia Sjouke
Worker at BMW airplane engine plant
19
Hendrik van der Zee
J. and A.J. van der Zee
Worker in Mauser factories
22
Dik den Otter
E. den Otter
Razzia after Operation Market Garden
4
Figure 1: Correspondence pairs and where forced labor occurred used for Map 5.
Map 5: Correspondence paths filtered by largest groups of correspondents
Conclusion
The Arnhem Postal History Project collection offers insight into both the postal history and the social history of the Netherlands. The Forced Labor group, although a small sample size, demonstrates the effect of German labor policy in occupied countries, sending men to factories in German, usually involuntarily. Censorship created delays in mail delivery, adding to the challenges of separation.
Kepler.gl was an effective tool to visualize the data. The size of the data set limited what conclusions could be drawn, but the maps did provide a good snapshot. The layers and filters allowed different views of the information to help develop further lines of research, such as a drill down on the correspondence between men in labor camps writing each other. Overall, kepler.gl worked well to map the correspondence and is a useful tool for digital humanities projects.
Paul Glaser, Dancing with the Enemy: My Family’s Holocaust Secret, 38–41. ↩︎
Kees Adema and Jeffrey Groeneveld, , The Paper Trail: World War II in Holland and Its Colonies as Seen through Mail and Documents, 277–84. ↩︎
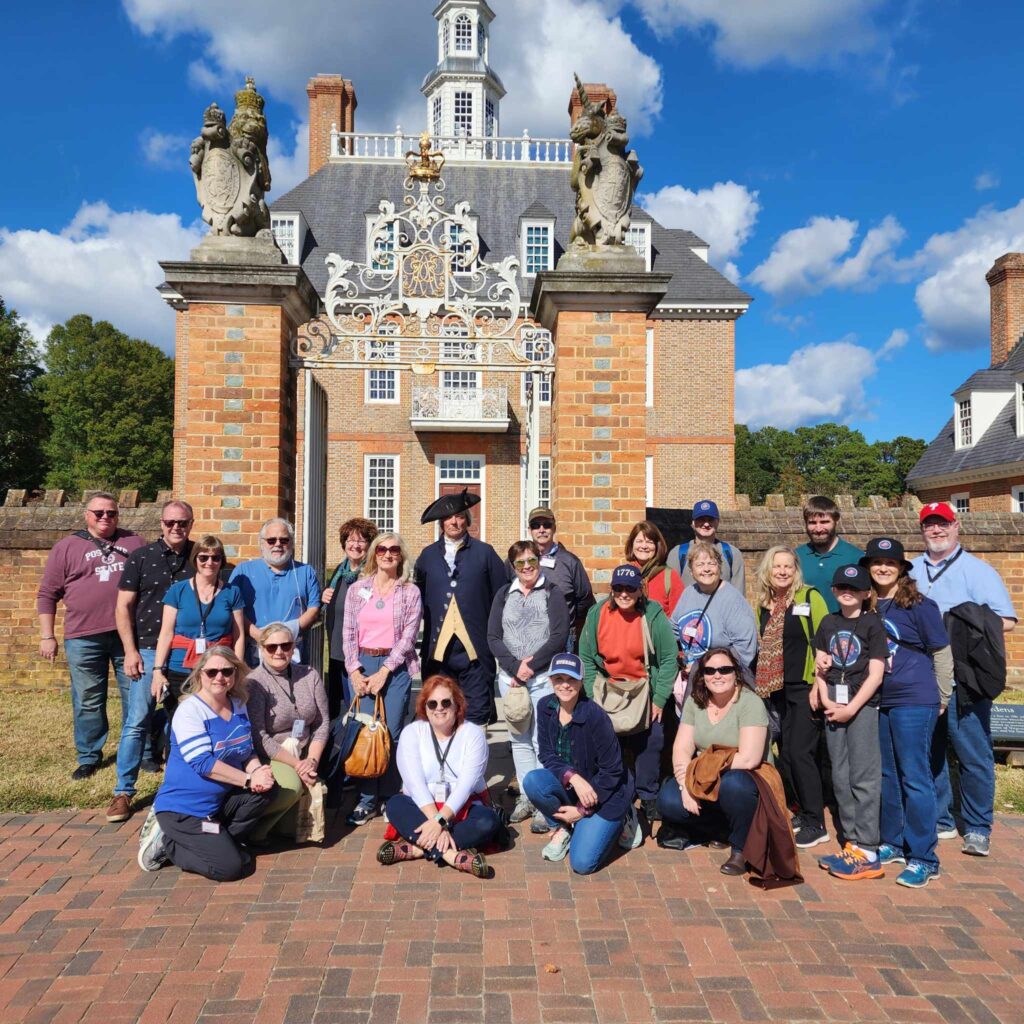
My Zoom book club, a spinoff of the podcast, decided we wanted to do a meet up, in Colonial Williamsburg, to celebrate our group and the podcast that brought us together. After a wonderful weekend, including dinner and a ghost tour with Liz Covart, almost half of us tested positive. We share well, apparently, a weird book and podcast loving COVID cluster.
Ron Carrington as President George Washington with members of Poor Richard’s Book Club, 23 April 2023.
Podcasts allow humanities scholars to engage with the public differently as a medium as they have an ability to reach wide audiences that may not traditionally interact with the digital humanities. In this picture are a music teacher and a professor who teaches teachers, a Canadian farmer and his wife, two lawyers, a family counselor, a nurse, and the Australian contingent, a healthcare advocate, a surveyor, and their son (Ii’m the one kneeling second from the left). A group brought together by a mutual interest in history and a podcast that not only made several people want to read the book discussed, but read it with other people. Podcasting offers an opportunity for humanities scholars to explore and are of their interest and research in way that can be both entertaining and educational. I was introduced to both Ben Franklin’s World and Revolutions as assignments in class. Through another non-scholarly podcast, I started listening to Dressed with fashion historians. And through The Green Tunnel I am learning about the Appalachian Trail even though I despise camping and anything more than and easy day hike.
Podcasts can be an introduction to the humanities, and reach a wide audience due to their accessibility. They allow a digital scholar to present their research or scholarship in a format that anyone can access and they can explore and share areas of interest in smaller, more digestible bites for a public audience. The medium of podcasting allows a more personal connection and engagement with the audience than most others in the digital humanities.
The popularity, reach and the less academic sound of podcasts should not be mistaken for less rigor. Podcasts are as much a tool as the others used in the digital humanities. Like the mapping and visualization tools, it requires its own set of data and research. The product may not be a graphic; it is still a synthesis of data and research. The script writing aspect requires the use databases and search tools as wells as an understanding of permitted use and copyright law. The addition of show notes to most podcasts can tie them further to related tools, as they may be part of a larger humanities project and make use of the other tools to supplement the discussion.
Podcasts are a versatile tool for the humanities scholar, as it can generate interest in a topic or bring in a new audience. They provide the public an opportunity to learn and explore something new and different and can open a door to learning more and exploring other interests. Their availability on the same platforms that most people are listening to music on opens up the potential audience for the podcast and potentially other projects.
And we are all recovered and reading Alan Taylors’s The Civil War of 1812: American Citizens, British Subjects, Irish Rebels, & Indian Allies.
WIkipedia’s reputation has improved from its inception, a site with the radical idea that non-experts should be able to contribute to knowledge on the world wide web. Not long ago, I would not consider Wikipedia a valid resource, but while I would not use it as a main source, I have found it is often a jumping off point for research. Understanding how Wikipedia entries is important in evaluating the value of an article and its accuracy. Given that chat bots also use it as one of their large language models, the ability to review entries and how they develop is useful.
Using the Digital Humanities page as an example, the “Talk” and “View history” sections provide insight into the development of the page and its contents. “View history” allows the viewer to see how the site has changed, as well as a side by side comparison of what each change did to the site. It also identifies the editor, linking to their user page and frequently a description of their expertise.
Digital humanities: Revision history at https://en.wikipedia.org/w/index.php?title=Digital_humanities&action=history
In the screenshot above, examples include a 27 November 2022 edit for unsourced material being added; a 3 June 2022 addition on Analysis of macroscopic trends in cultural change was added, then changed slightly.; and on 5 January 2022 entries reflecting the rendition of the unsourced work with comment, and the subsequent removal of it again. The 27 November 2022 change is made by ElKevbo, the third highest contributor to the site, and/or his biography, works in the digital humanities and higher learning.
Adding to this are comments in the “Talk” section, a discussion of what content should be added. I particularly liked the following post, discussing areas to improve their understanding and that of other users:
Technology, criticisms, & future at https://en.wikipedia.org/wiki/Talk:Digital_humanities
The section also discusses some of the editing decisions and collaboration, such as an early crowdsourcing event at THATcamp (The Humanities and Technology Camp) in Australia making several edits. The first large batch of edits were made by the in the field thinking and learning about the digital humanities.
Understanding the source of the information, and that Wikipedia editors are trying to maintain community standards, lends credibility to the entries. AI crowdsources information through the text it was trained on, including Wikipedia. While it synthesizes information rapidly, and by using large, internet based data files, it is still only as good as the crowd it is using. Its inability to show sources makes it another useful starting point, but not necessarily an ending point. I queried Chat GPT about its use of Wikipedia, with this response:
I don’t have direct access to the internet or specific databases like Wikipedia in real-time. Instead, I’ve been trained on a diverse range of internet text available up until my last update in 2022, which includes information from sources like Wikipedia. My responses are generated based on patterns and information learned from that data.
If you ask me a question about a topic, I’ll generate a response based on the knowledge I’ve acquired during my training. So, while I can’t access Wikipedia directly, I’ve learned from its content and can provide information based on what I’ve previously read and absorbed.
Wikipedia, a world of words askew, A dance of data, a linguistic brew. No capital chains to bind its grace, In ee cummings’ style, it finds its place.
A symphony of facts in a tangled rhyme, Hyperlinks weaving through the sands of time. No rigid structure, just free-flowing streams, In Wikipedia’s garden, knowledge dreams.
Lowercase whispers tell tales untold, As wikis unfold, in pixels bold. Syntax surrenders, conventions flee, In this textual playground, wild and free.
Beneath the letters, a universe blooms, A kaleidoscope of knowledge looms. No need for order, no need for rule, Wikipedia dances in the vastness, cool.
A symphony of voices, a chorus untamed, In cummings’ spirit, where no word’s framed. Wikipedia, a poem of pixels and links, In the language of chaos, information syncs.
wiki leaks words, a cacophony, a melange of info sprawling unchained un bridled in its verve un stop-pable unwavering it grows
words dance in links a tap dance of thoughts meandering through time space no capitals or spaces just the pulse of info in a torrential race
oh, wikipedia! encyclopedic cacophony where knowledge meets chaos in a glorious blend of facts and conjecture yet a haven for seekers in a digital splendor un matched and profound
The poems above illustrate both the questionable and good about AI crowdsourcing. The Chat GPT prompt was “write a poem in the style of ee cummings.”The first try has the syntax and rhythm of Cummings, but it was not until the second try that it picked up the trait Cummings is known for, the lack of capitalization. AI did not recognize initially, although the Wikipedia entry on Cummings describes it, with several examples of poems.
The challenge of crowdsourcing, through a Wikipedia or Wikipedia of the future or AI, remains the expertise and the biases of the crowd. Lockett engagement with her students at Spelman as being motivated by realizing how many gaps in information existed about their college and those like it, and Black women in particular1. Crowdsourcing brings a myriad of experiences, expertise and interests to the world in a very shareable way, however moving into the future, identifying the gaps and blind spots will be critical to their overall effectiveness as a tools.
Lockett, Alexandria. “Why Do I Have Authority to Edit the Page? The Politics of User Agency and Participation on Wikipedia.” In Wikipedia @ 20: Stories of an Incomplete Revolution. Edited by Joseph Reagle and Jackie Koerner (MIT Press, 2020), https://doi.org/10.7551/mitpress/12366.003.0019Links to an external site.., p 213. ↩︎
Working with three different digital tools highlighted the ways digital tools can help understand data as well as develop new lines of research. Using the same set of data, the WPA Slave Narratives Project, connections were explored using Voyant 2.0, kelper.gl, and Palladio. Each of the tools offered a way of understanding the information and had value as a stand alone analysis, however they also complement each other.
The tools revealed different aspects of the narratives. After working with Palladio and seeing the connections between topics and demographics, I think taking the topics that appeared most often (or least) in the Alabama example would be interesting to run the data again in Voyant 2.0 and see what the context was. I was surprised at the religion-Sunday-church-wedding -baptism connections, and think bringing Voyant’s analysis in for similar trends in other states may offer insight. This struck me as baptism was the item mentioned least, and may be worth exploring, as both religion and church were fairly strong topics, why was baptism less so given it is a tenet for belonging to many churches. It may also suggest church as a safe space or as a monitored space, threads worth pulling using text analysis combined with network analysis.
After listening to a graduate student presenting her research on African Americans and migration in South Carolina this afternoon, I think I would like to test use of the three tools in conjunction with each other on a related question. Specifically, I would like to use them to develop visualizations of the movement of the formerly enslaved, whether they traveled a few minutes from the place of enslavement or chose to build a life in another location completely. The Alabama sample, for example, shows limited movement, until you take into consideration that the interviews took place over a short period, in Alabama. Kepler.gl and Palladio can show where those that remained in Alabama did not tend to travel far, but the entire data set would help expand the geospatial view. Voyant would be a useful tool to add the context to the data, and potentially add some information on those who left as part of the Great Migration.
Palladio is open source software that allows users to visualize data through mapping, graphs, and tables. Data can be represented as points on a map, connected by arcs and scalable, in a list or table form and in a gallery grip layout for organization. There are also timeline and timespan filters that it did not explore.
One of the interesting features in graphs is the dynamic interface, allowing manipulation of the network graph to isolate or drill down on nodes and connections. For example, in the graph below, the topics and work performed data sets were compared highlighting some of the differences in experience and points of view (Figure 1)
Figure 1Figure 2
Figure 2 shows the relationship between where the person was interviewed compared to where they were enslaved. The grouping suggests limited movement between the two locations, and highlights an area to compare the WPA interview data to census data to understand the paths of movement and whether the Alabama data set is representative of all the movement post-liberation. Comparing this to census data from 1860/1880 and 1930 might be an interesting follow up to this visualization.
Palladio was fairly straightforward to use, with an excellent tutorial page to help with adding data, data structure and the different functions of the software.
In the digital humanities, mapping offers another way to provide information in a way that engages the audience. Histories of the National Mall, for example, uses a map interface as a gateway for visitors to explore the Mall in a different way. As the developer explained, there are no markers about the history of the space – the Omeka based site serves as digital historical markers.
Digital mapping tools are powerful for visualizing data. Through digital mapping, relationships, change over time, aggregation or dispersion, and paths/vectors can be highlighted or explored. In an exercise with the Kepler.gl, layers and filters were added to datasets to understand patterns and identify possible relationships between the data (interview information from the WPA Slave narratives). Some of the questions it left me with were regarding the clusters of interviews geographically, I am thinking I should have played with adding towns and cities, to look closer at what communities may have been targeted by the interviews, or whether it was a random distribution of the survivors of enslavement.
The timeline map also raised some interesting questions as the interview dates clustered in the spring and summer, vice an even distribution across the dates. It leads to the question of were the interviews rushed, or funding running out, or was it just the time available (See map below).
I understood text mining as a concept, using Voyant, with all its highs and lows, helped my comprehension. I realized my knowledge was thin, familiar with word clouds and graphing, working with Voyant, and I am curious about other tools as well now, I was able to delve into the context, and found some surprises.
Sinclair and Lockwood discussed the two basic questions for text mining:
a means of taking linguistic and semantic characteristics and seeing the different uses and context
taking unfamiliar work and making it understandable
The experience I had exploring the Kentucky dataset supports the idea. For Kentucky, I ended up with this cirrus
The prevalence of the word “War” surprised me, until I dug into the context. War was discussed as part of the story of participants, in the context of the Civil War, and as a verb. War, it turned out, also meant was. Simply looking at the word cloud or even the trends, would not have shown the other meaning, and just left it as the interviewees must have been deeply invested in the war.
Voyant was a little challenging sometimes, with functions working some times and not others, but the value of the tools outweighed any issues with the program.
The text mining exercise was interesting and made me think more about what can be learned, and how little I knew at the start.
Digital Humanities issues, tools, and resources
Warning: Attempt to read property "comment_ID" on null in /home/kejacobs/public_html/wp-content/plugins/subscribe-to-comments/subscribe-to-comments.php on line 72
Warning: Attempt to read property "comment_author_email" on null in /home/kejacobs/public_html/wp-content/plugins/subscribe-to-comments/subscribe-to-comments.php on line 592
Warning: Attempt to read property "comment_post_ID" on null in /home/kejacobs/public_html/wp-content/plugins/subscribe-to-comments/subscribe-to-comments.php on line 593